Below are examples of what you can see with the data you are collected with PingPlotter. If you still need to collect data with PingPlotter you can head over to Pt 1 which will guide you through the setup and collection steps.
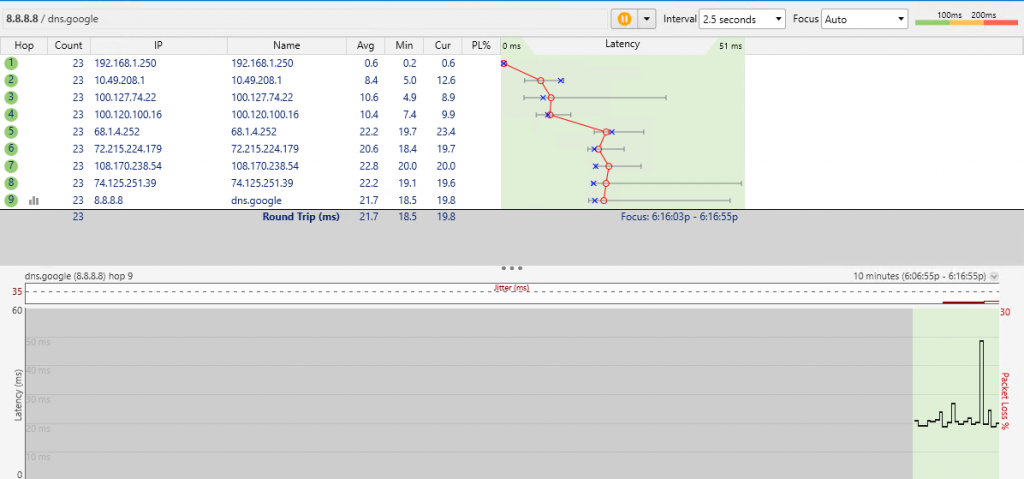
Example 1. Below is a perfect example of what you want to see. This was a quick test, but you see the following –
- 0% packet loss to and from the detestation
- < 5 milliseconds ping time to the first hop (in this case my router/wifi access point)
- < 30 milliseconds for data to be received by 8.8.8.8 and sent back to my network
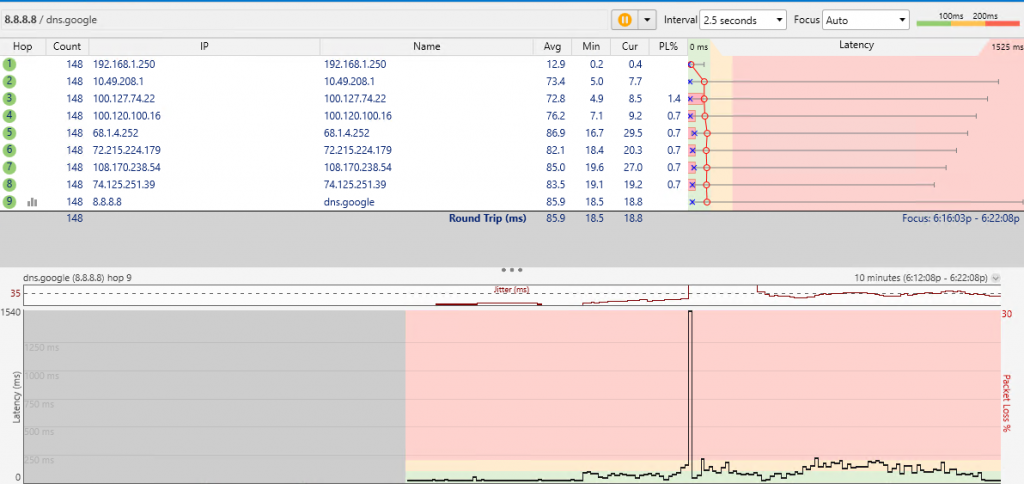
Example 2. Possible internal network issue, due to the high latency between the computer and router/wifi access point. Packet loss < 2% probably not noticeable, but could be pointing to an issue.
- Low packet loss.
- High latency/ping time to the first hop (in this case my router/wifi access point) ~12 milliseconds
- > 80 milliseconds for data to be received by 8.8.8.8 and sent back to my network
- High jitter (the fluctuation of latency over time, meaning a high standard deviation from your average ping)
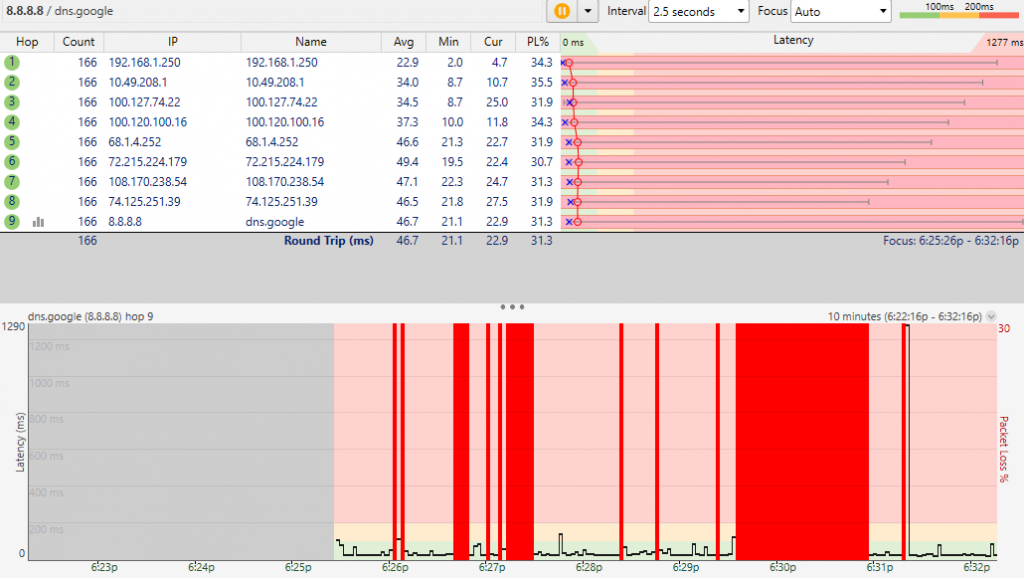
Example 3. High packet loss, with an internet outage.
- High packet loss anything between 2%-5% is going to be extremely noticeable on calls, video chats, and steaming services.
- High latency/ping time
- High jitter
- Short ~3 minute internet outage
Places to Start
If connecting via wifi, check the placement of your equipment. Is your access point buried in your master closet? Or is it centrally located in your house? Location is important, example 3 was created by taking the antenna off my access point to simulate poor access point placement.